Introduction
Oracle (ORCL) was founded in 1977 and today is one of the largest enterprise grade database, middleware and application software providers in technology. Although the company has been slow to adopt cloud computing, it has expanded its operations in recent years. Today the company offers cloud solutions and services that customers can use to both build and manage a variety of cloud development models.
To catch up and build its position in the cloud computing space, the company has been very active on the acquisition front. Additionally, Oracle has been investing heavily in these acquisitions to better compete with major competitors such as AWS, Microsoft Azure, Salesforce and IBM. Since the market is already overcrowded, there is the risk that these acquisitions might eventually hurt Oracle’s profitability.
In 2010 Oracle acquired Sun Microsystems and began selling hardware products and services consisting primarily of servers and storage products. However, many experts believe that lower hardware volumes can ultimately hurt Oracle’s topline growth as it is also a low-margin business.
According to Zacks Investment Research, Oracle offers cloud solutions and services that are built upon open industry standards such as SQL, Java and HTML5. Moreover, Oracle Cloud provides access to application services, platform services and infrastructure services for subscription. Oracle also has an Enterprise Manager offering that allows them to manage cloud environments for clients. An analyst from Zacks believes that Oracle is benefiting from strong adoption of cloud-based solutions, comprising NetSuite ERP, Fusion ERP and Fusion HCM.
For example, as reported by Zacks, 8×8 and Zoom Video Communications selected Oracle Cloud Infrastructure services to address business needs, which Zacks believes is a testament to the strength of its cloud offerings. Perhaps more importantly, Zacks also suggested, and I quote “strong demand for the latest autonomous database supported by ML is anticipated to drive top line and provide the company a competitive edge against Amazon Web Services (“AWS”) in the Database-as-a-Service market.”
Finally, Morningstar gives Oracle a wide economic moat rating due to the high customer switching costs. They further point out that Oracle’s relational database and ERP software provide the backbone for many companies’ mission-critical data. Therefore, Morningstar suggests that migrating such data away from Oracle is not only costly and time-consuming, but would have to be done very carefully because corruption of this data has the potential to decimate a business. Additionally, there is the risk that valuable customer data could be lost for good.
Oracle Fundamental Value Based On My Favorite Valuation Metrics
Since I am known by many as Mr. Valuation, I feel it is important to point out that I always look at valuation from numerous metrics and perspectives. I am often asked what my favorite valuation methodology is, and my answer is always the same – all of them. Therefore, what follows is a summary of Oracle’s valuation through the lens of the various metrics available on FAST Graphs – the fundamentals analyzer software tool.
As the reader reviews each of these price/valuation references based on numerous metrics, I ask that you recognize the real-world validity of each. In other words, regardless of how these relationships were generated, recognize how the company’s stock price has historically correlated to each. By doing so, the reader will receive clear and undeniable evidence that the ultimate producers of shareholder returns are functionally related and generated through business results. This includes both capital appreciation and total dividend income and growth. Succinctly stated, business performance is significantly more important than price action in the long run.
Oracle: Undervalued Based on Adjusted (Operating) Earnings
Although I do not have a favorite metric, but instead prefer to evaluate many, operating earnings also known as adjusted earnings is my go-to metric. By that I simply mean that operating earnings are the first valuation metric that I examine. If valuation does not make sense based on operating earnings, then I see no reason to waste time digging deeper. On the other hand, when valuation is reasonable or better attractive, then and only then does it make sense to examine the company and its fundamentals more extensively.
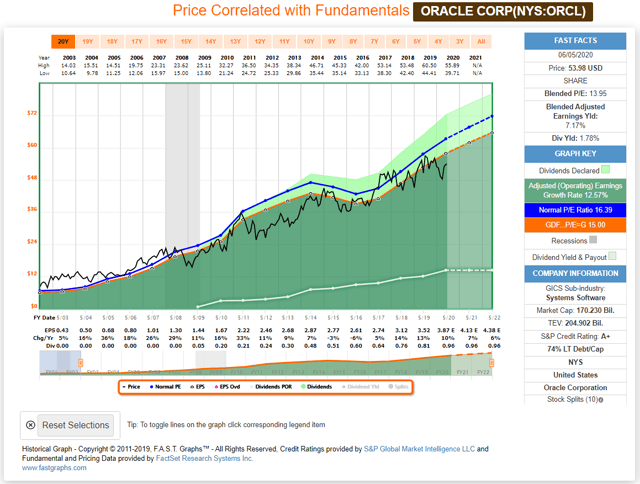
From the following screenshot based on adjusted (operating) earnings, Oracle is clearly currently available at an attractive valuation. The orange line on the graph represents an intrinsic value reference of a multiple of 15 times earnings. This level of valuation would be considered fair value. The blue line is, in essence, a best fit or normal P/E ratio of a multiple of 16.39 times earnings that the market has historically applied over this specific timeframe. By examining these two valuation references, we can see (discover) optimum times to buy, sell or hold. Additionally, we see that the market will occasionally misappraise the stock based on valuation, but also see that price inevitably moves back into alignment.
Oracle: Undervalued Based On Forward Owners Earnings
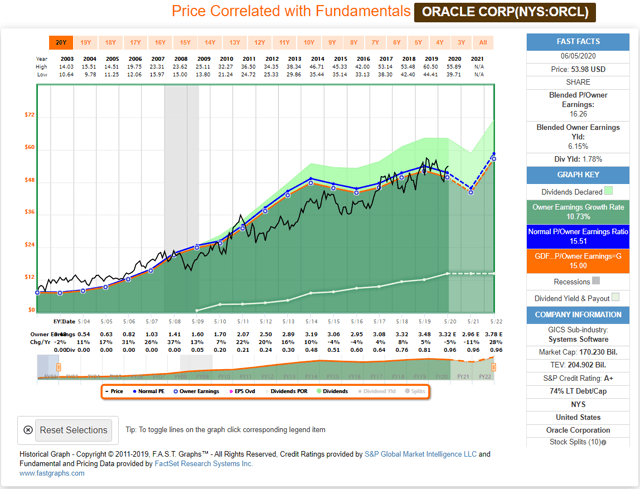
The next valuation metric is the valuation method that Warren Buffett presented in Berkshire Hathaway’s annual report in 1986. Summarized, owner’s earnings suggest that the value of a company is the total of the net cash flows expected to occur over the life of the business, minus any reinvestment of earnings. Therefore, owner’s earnings include an estimate of capital expenditures (CAPEX).
Based on this valuation methodology, Oracle appears modestly overvalued currently but undervalued based on forward expectations. This is the only valuation methodology that I will present that suggest that Oracle is not currently undervalued. On the other hand, Oracle does not look excessively overvalued on this basis either.
Oracle: Undervalued Based On Operating Cash Flow
Although operating cash flow does not always provide a clear valuation reference, for many companies it does. Additionally, there are certain companies where operating cash flow as a valuation tool is more relevant than earnings. Additionally, I also embrace operating cash flow as a clear way to determine if the company’s dividend is safely covered.
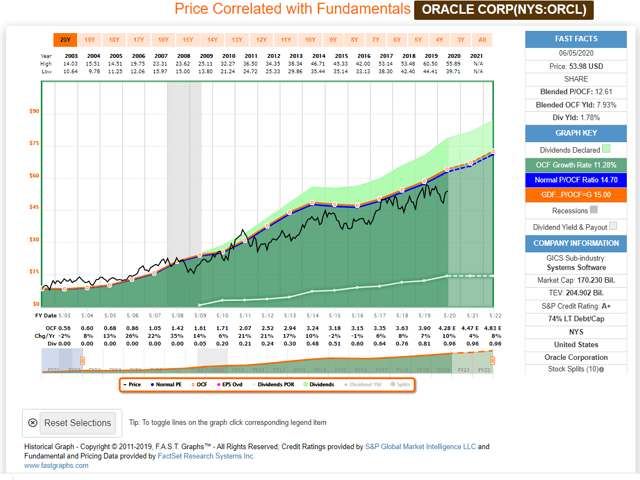
Oracle is a dividend growth stock, and the company does enjoy an A+ credit rating from Standard & Poor’s. However, the company also has 74% long-term debt to capital. Consequently, with this much debt it is important that the dividend is strongly covered by cash flow. In the case of Oracle, consensus operating cash flow estimates for 2020 (fiscal year ends in May) are $4.28 covering a dividend of $0.96. Therefore, Oracle has ample cash flow to pay its dividend.
However, from a pure valuation perspective, Oracle has historically traded at a normal price to operating cash flow multiple of 14.7. Therefore, its current blended price to operating cash flow of 12.86 suggests that Oracle is undervalued based on historical cash flow normal valuations.
Oracle: Undervalued Based On Free Cash Flow
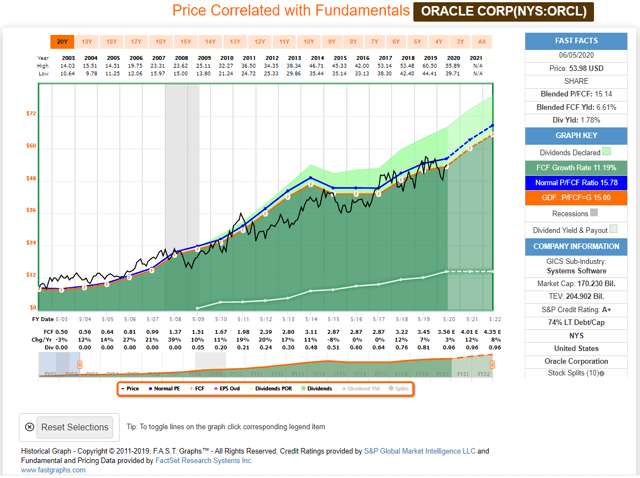
In addition to operating cash flows, free cash flow valuations also provide insight. Simply stated, free cash flow is the money that the company has left over after what it needs to operate its business. Based on price to free cash flow multiples, Oracle is comfortably within the range of 15 to 16 times free cash flow with a blended price to free cash flow multiple of 15.44.
Additionally, I consider free cash flow coverage of dividends as the acid test for dividend safety. Oracle has more than ample free cash flow to cover its dividend.
Oracle: Undervalued Based On Price To EBITDA
EBITDA (earnings before interest taxes depreciation and amortization) is an excellent metric for illustrating how well the business is performing as an operating entity without the confusion that accounting convention can bring to the equation. Especially non-cash items such as depreciation and amortization. To me personally, I see EBITDA as a soft form of both earnings and/or cash flows.
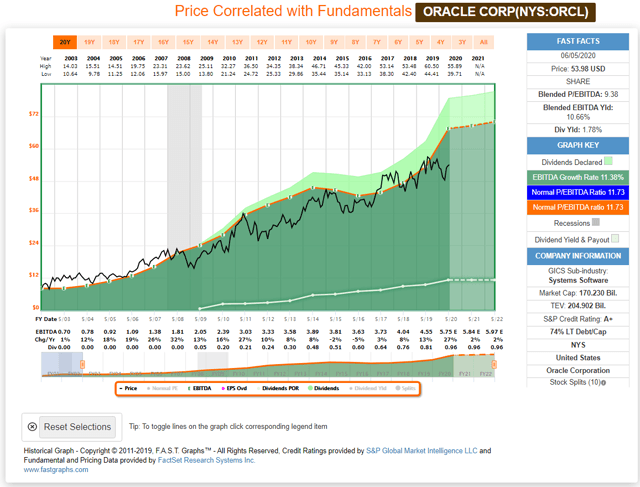
Oracle appears significantly undervalued based on its normal historical price to EBITDA ratio. Oracle currently trades at a price to EBITDA ratio of 9.86 compared to its historical normal price to EBITDA ratio of 11.73. This also translates into a very healthy EBITDA yield of 10.66%.
Oracle: Undervalued Based On Price to EBIT
Evaluating a company based on its price to EBIT is another valuable valuation reference. The primary difference between EBIT and EBITDA is that normal cash operating expenses are included, but non-cash charges such as depreciation and amortization are not.
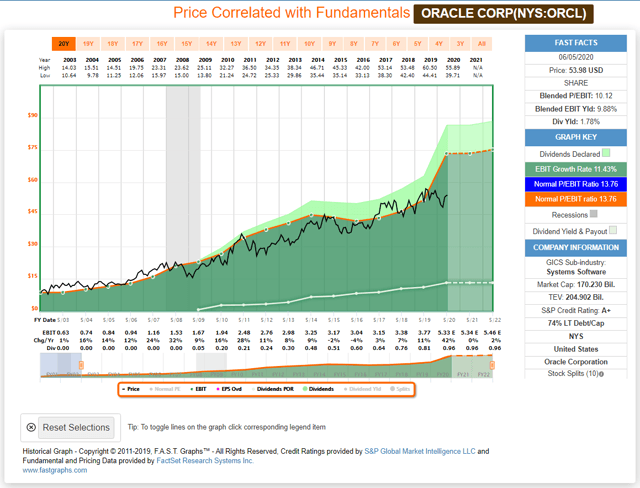
Once again, Oracle appears to be significantly undervalued with the current blended price to EBIT of 10.12 compared to its normal historical ratio of 13.76. It is also interesting to note that EBIT similar to EBITDA growth is expected be very strong in fiscal year 2020. As a side note, Oracle’s 2020 fiscal year has already ended at the end of May 2020. However, it is important to remember that financial reports are usually published approximately 45 days after the quarter ends. Nevertheless, it is also highly likely that the current consensus estimate will be very accurate since the year has technically already ended.
Oracle: Undervalued Based On Valuation Ratios EV/EBITDA and Price To Sales Multiples
In addition to valuing a business based on multiples of earnings and/or cash flows as seen above, value investors also utilize additional valuation ratios. Enterprise value to EBITDA expressed as a ratio and price to sales are two commonly utilized valuation methodologies.
Oracle: EV/EBITDA Ratio
As illustrated by the following FUN (financial underlying numbers) graphic, Oracle ended fiscal year 2019 with an Enterprise Value to EBITDA ratio of 12.24. Not shown on the graph is that as of Oracle’s last reported quarter (February 2020) Oracle’s Enterprise Value to EBITDA ratio had fallen to 11.03. Both of those measurements would indicate a fair and reasonable valuation for Oracle based on Enterprise Value to EBITDA.
Oracle: Price To Sales Ratio
Another ratio favored by value investors is the company’s price to sales ratio. As seen by the following graphic, Oracle’s price to sales ratio is on the lower end of historical norms thereby indicating attractive valuation.
Oracle: Price-To-Book Value (common equity)
Oracle’s price to book value has increased from approximately 4 times book in 2018 to almost 8 times book in 2019. However, that correlates with the fact that Oracle’s book value per share has fallen from $10.79 in $2018 to only $5.84 by fiscal 2019. Although book value is not necessarily a great valuation reference for software companies, Oracle does offer hardware through its Sun Microsystems’ acquisition.
Oracle: Higher Than Average Historical Yield Indicates Attractive Value
When examining dividend growth stocks, I find it quite useful to value the stock based on the company’s current yield in relation to its historical norms. There is an inverse relationship between value and yield for dividend growth stocks. Yields are highest when valuations are lowest – and vice versa. Currently Oracle offers one of its highest yields over its history as a dividend payer.
Oracle: Returning Capital to Shareholders
Dividend and Dividend Growth
Since Oracle instituted its first dividend in 2009, the dividend has grown by a compound annual growth rate of 32.1%. This clearly classifies Oracle as a dividend growth stock with 11 years of consecutive increases and counting.
Buying Back Shares at Attractive Valuations
Although many people are cynical regarding share buybacks, I consider them an attractive opportunity for increasing shareholder value if (and only if) the stock is being bought at attractive valuations. Since 2009, Oracle has reduced their common shares outstanding (CSHO) at a compound annual growth rate of 3.1%. I consider this a prudent decision because Oracle’s valuation has been reasonable or undervalued over this entire timeframe.
Summary and Conclusions
In closing, I consider Oracle an attractively valued dividend growth stock with an emphasis on growth. Oracle has a long history of generating above-average growth of earnings and cash flows, and since paying its first dividend in 2009, its dividend growth has been nothing short of extraordinary. Therefore, I offer Oracle as a long-term opportunity for above-average long-term total return and dividend growth.
Secure Your Future – F.A.S.T. Graphs
