Introduction Interest Rates
Many investors are attempting to justify higher stock “valuations” because interest rates are at historical lows. I would agree that lower interest rates could affect “market valuations” based on the simple law of supply and demand. The concept is simple, when fixed income offers lower returns it logically stimulates more demand for equities where higher returns can be found. In contrast, when fixed income provides high yields, it reduces the demand for equities because they in fact become less competitive. However, that is market value which functions in an auction market – again, under the rules of supply and demand.
However, lower interest rates have not in recent times caused P/E ratios (common stock valuations) to rise. In my experience, there will be an inverse relationship between interest rates and stock valuations (P/E ratios) when stocks are being valued properly by the market. However, in the real world, there are many other factors that I believe are significantly more important than the level of interest rates, which are an exogenous force. In other words, forces that are internally part and parcel of the underlying business are more relevant to valuation than outside forces like interest rates.
To be clear, by internal forces I am referring to the actual operating results and success of the business itself. In the long run, the company’s ability to generate earnings and cash flows will be the predominant determinant of future returns and valuation at any point in time. Good fast-growing businesses are worth more than poor slow-growing businesses.
Nevertheless, the key part of the above thesis is the phrase – in the long run. This is simply because markets can be dominated by investor sentiment (fear or greed) in the short run. However, business results (fundamentals) will inevitably reign supreme. This is why I always say that I trust fundamentals more than I trust short-term price movements.
NETAPP Inc. (NTAP): A Good Example In The Extreme
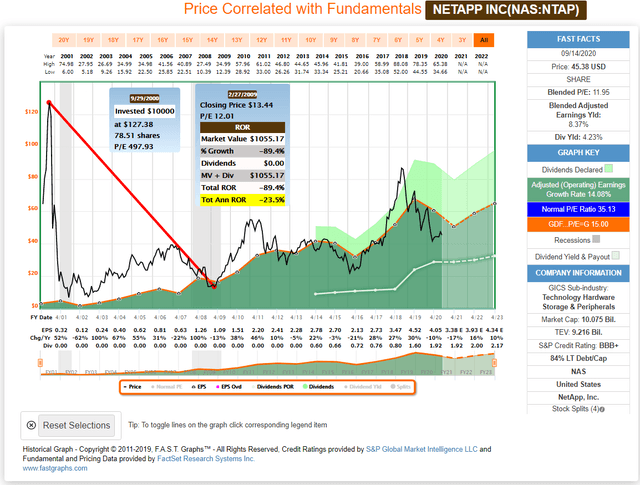
Over the years I have concluded that often the greatest insights can be gleaned from evaluating the extreme. These completely aberrant circumstances cast a bright spotlight on the reality of sound fundamental principles. A case in point would be NETAPP, a technology stock that participated in the tech bubble of 1995 to 2000. Although extreme, NETAPP is one of many tech stocks that became insanely valued during the tech bubble which led to close to a decade of extreme losses from its peak valuation (see performance calculations below).
I also selected this example because it repeated this lesson several times since calendar and fiscal year 2000. Periods of high valuation inevitably culminated in long periods of very poor performance when the market value (sentiment) inevitably reverted to fundamentally based mean valuations. Additionally, with this example we also see the importance of earnings relative to long-term performance and valuation. In the long run, price follows earnings. However, price can get disconnected for short periods of time (which can actually last years) but inevitably move back into fundamental alignment.
NETAPP Inc.
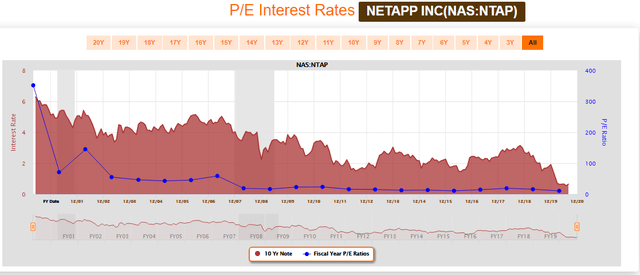
But perhaps most importantly and relevant to this article, NETAPP provides a quintessential example of interest rates and P/E ratios moving down together in tandem. The red shaded area on the graph are 10-year T-bond rates, and the blue line plots year-end P/E ratios. As you can clearly see, the interest rate steadily dropped from 6.29% on May 31, 2000 to less than 1% by August 2020. Additionally, NETAPP’s P/E ratio fell from the extreme 352 in fiscal year ended April 2000 to 71 by fiscal year ended April 2001.
As you can see, the P/E ratio for NETAPP has continued to fall in direct proportion to interest rates to its current blended P/E ratio of only 11.95. Again, this is an extreme example, but nevertheless, a clear case where fundamentals, primarily the headwinds of overvaluation, were significantly more relevant than interest rates on NETAPP’s valuation (P/E ratio).
Intrinsic Value Versus Market Value: General Dynamics Corp. (GD)
Intrinsic value is another matter altogether. Intrinsic value is most rightfully calculated based on the amount of cash flows (you can substitute earnings, revenues, free cash flow, etc.) that the investment (stock) generates on behalf of its stakeholders. Those cash flows represent a clearly calculable rate of return that the investment can deliver. The benefit of calculating intrinsic value is that it represents a value that allows you to fully participate in the operating potential (growth) of the business. The more cash flow the business produces, the more valuable the business is to its owners.
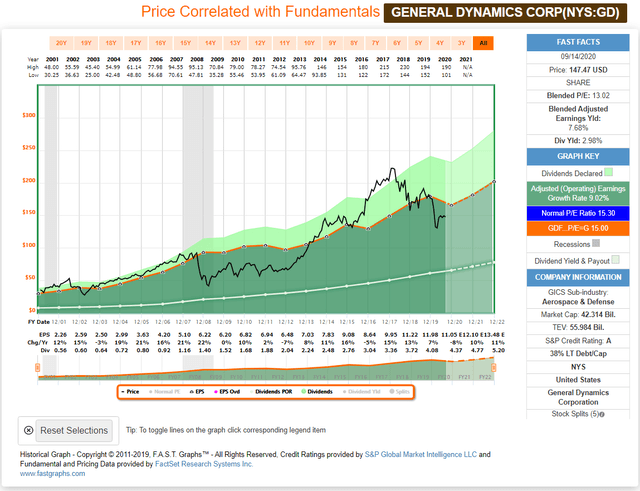
Stated more clearly, when you invest in a stock when its price is aligned with its fair value, your money is correctly positioned to fully participate in the results that the business produces on its shareholder’s behalf. A quintessential example would be General Dynamics Corp. The orange line on the FAST Graph below represents a fair value P/E ratio of 15 for General Dynamics since 2001. Notice how the stock price tracks the company’s operating results over the long run. But more to the point, note what happens when price is out of alignment with fair value – over or under.
Although these periods where market value is not reflective of intrinsic value can last longer than investors might be comfortable with, inevitably as the graph depicts, stock price will move back into alignment with fundamentals. It is only a matter of time.
General Dynamics
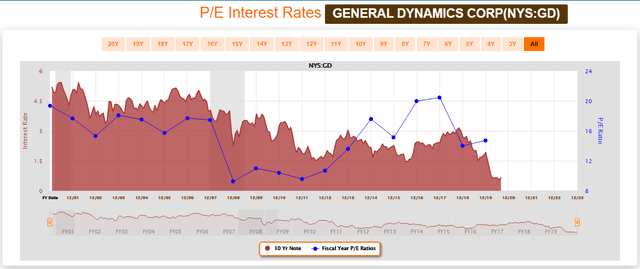
When you evaluate the impact of interest rates on General Dynamics’ valuation going back to 2000, you get mixed signals. From fiscal and calendar year 2000 through fiscal year-end 2008, we see interest rates dropping and we see P/E ratios following suit. For all those years, we have falling interest rates and simultaneously falling P/E ratios.
However, starting in fiscal and calendar year 2011, we saw 6 years where interest rates trended down with P/E multiples moved inversely up as theory suggests. However, since 2018 we once again see P/E ratios following simultaneously as interest rates fall.
Valuation Often Ignored Is More Important Than Interest Rates
A very common refrain that I hear today is that the market’s high valuations are justified by low interest rates. As a result, the same investors are willing to overpay because they believe that low interest rates justify their position.
However, you can overpay for even the greatest business. What this means is that you are willing to accept a rate of return that is lower than the company generates as a business. The extreme version of this is commonly referred to on Wall Street as “the greater fool theory.” This theory states that you foolishly pay more for a stock than it is worth, solely on the basis that a fool greater than you will hopefully be willing to pay you more than you originally did.
The problem with overvaluation is that you are simply capitulating by accepting a lower rate of return than you should (than the company can produce on your behalf) while simultaneously taking greater risk (valuation risk) to earn this lower return. You can measure this, for example, by looking at dividend yields. When you overpay, you will receive less dividends than you would if you had bought the stock at an attractive (fair) valuation. Your capital appreciation potential will also be lower based on the reality that stocks inevitably revert to the mean. As Warren Buffett so aptly put it: “I would be a bum on the street with a tin can if the markets were always efficient.”
Walmart a Classic Example of The Long-Term Risk Of Overpaying For Even The Greatest Business
During the irrational exuberant period – which culminated in calendar year 2000 – Walmart was a great business that was trading at a ridiculously high valuation. As a result, long-term investors would have made very little money over the next 16 years despite the business doing great. Nevertheless, when we fail to heed the lessons of history, they usually repeat themselves. This is clearly what is currently going on with Walmart and its current lofty valuation.
Walmart (WMT)
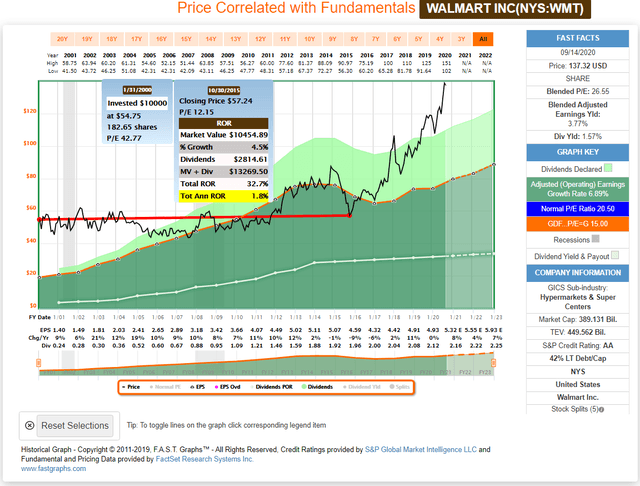
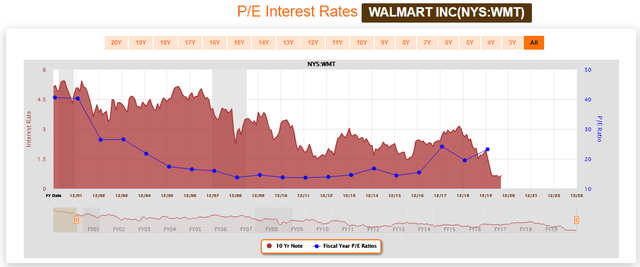
But again, as it relates to this article, Walmart’s P/E ratio (the blue line) fell in tandem with interest rates (the red shaded area) for more than a decade. The inverse relationship between interest rates and stock values does not automatically hold true. More dominant direct forces such as high valuation is significantly more relevant as Walmart’s historical results clearly illustrate.
Additional Thoughts
To simplify the above, attempting to justify overvaluation is partially ignoring the reality that the market does not always correctly appraise the value of the business. Once again, market value and intrinsic value are not the same thing. One is simply based on sentiment, while the other is based on fundamental value (CASH).
Additionally, I want to further address the interest rate discussion. For starters, I am not suggesting that interest rates should not be taken into consideration. However, as they relate to intrinsic value, they only have an effect if they empower the business to generate a greater future stream of earnings or cash flow. If they are not helping the company generate more cash flow, then the willingness to pay a higher valuation is simply capitulation. In other words, because I cannot get a good return on fixed income, I am willing to overpay for an equity even though it does not internally generate enough yield to compensate me for the risk I would be taking.
Moreover, when you are looking at consensus estimates and company guidance, I would stipulate that those estimates include considerations for the effect, if any, interest rates would have on the business. In other words, those future cash flow estimates have already taken interest rates into consideration. The following forecasting calculator on Microsoft suggests that 31 analysts expect Microsoft to grow earnings at 13% per annum through 2023. That is remarkable growth, however, that growth does not justify a blended P/E ratio of 35.30, which represents a meager earnings yield only 2.83%.
This begs the question, are you willing to risk the possibility of losing 37% of your money over the next two and three-quarter years for an earnings yield of 2.8% and a dividend yield of less than 1%. If you invested in Microsoft today, that is precisely the risk and the reality that expected future cash flows are likely to provide.
Microsoft Corp (MSFT)
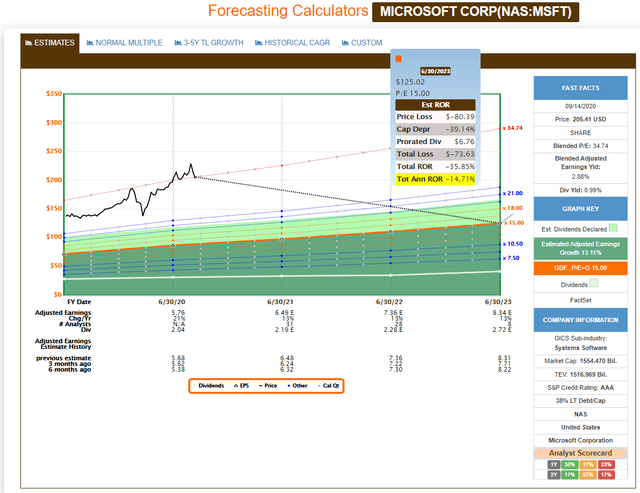
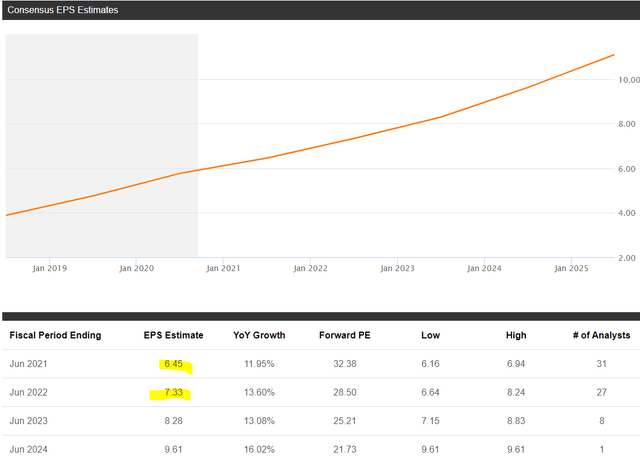
For additional information, I have added estimates taken from Yahoo Finance, which gathers their data through Reuters and from Seeking Alpha, which gathers their data from Standard & Poor’s. Although not identical to what FAST Graphs is getting from FactSet, the earnings numbers are reasonably consistent across all 3 forecasts.

How Would Interest Rates Affect Companies With No Debt
But at the end of the day, that expected stream of income, and of course in reality the actual stream of income produced will be the final determinant of return and value. As a logical example, a company that carries no debt is unlikely to achieve any direct benefit from low-interest rates. Perhaps the company’s customers would have more money to spend and therefore buy more of the company’s products or services. If that were true, then the business’ future cash flows might increase and so would the company’s intrinsic value along with it.
USANA Health Sciences, Inc.: (USNA): Participating Directly In The Business’s Success
I understand that people are not suggesting that low interest rates directly benefit businesses. Instead, people believe that lower interest rates justify higher valuations because equities become the only game in town when interest rates are as low as they are today. Again, as I stated many times, that could have a short-term effect on market value. However, I continue to contend that lower interest rates do not always directly impact the value of the business.
USANA Health Sciences is a classic example of a pure growth stock with no debt on its balance sheet. In this example the company started out when its stock was fairly valued at a P/E ratio equal to its earnings growth rate in 2003. Therefore, over that timeframe, the company generated an annualized rate of return of 17.8%, which was in direct proportion and correlation to its earnings growth. However, the reader should also note that there were several time periods when the company’s stock price was temporarily overvalued and undervalued by Mr. Market. Stock prices are not always in alignment with fair value in the short run. But, they do tend to move into alignment with fair value in the long run.
USANA Health Sciences, Inc.
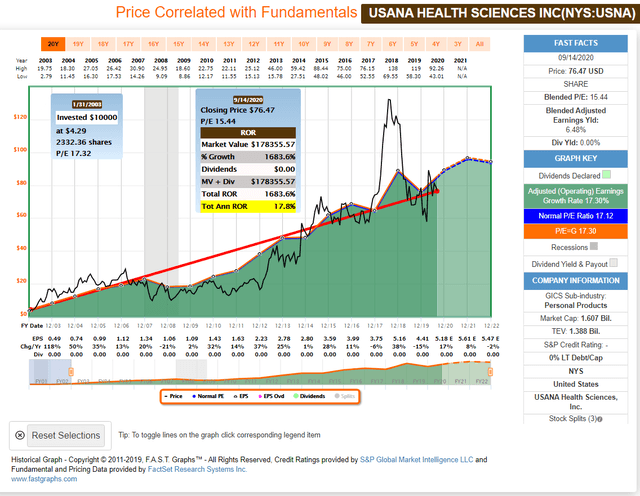
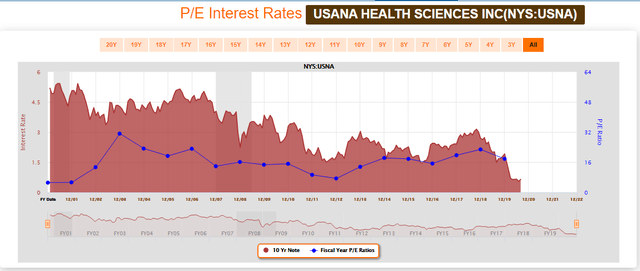
Interestingly, from calendar year 2004 through 2012, USANA Health Science’s P/E ratio fell in direct lockstep with interest rates. In other words, interest rates had little or no effect on the company’s valuation over that 8-year timeframe. The correlation between valuation and interest rates, as defined by conventional wisdom, did not hold water.
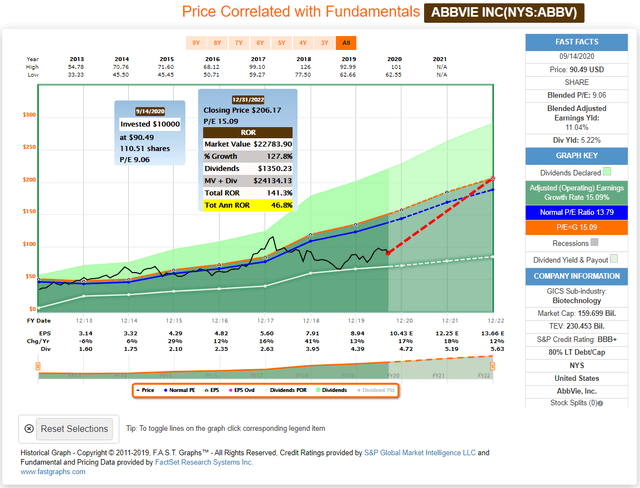
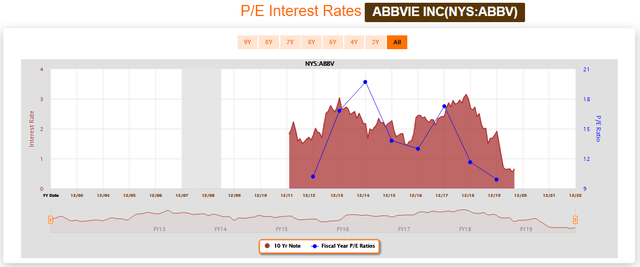
In contrast, a company with a lot of debt that is borrowing very cheaply and earning significantly higher returns than their borrowing costs, might therefore be capable of generating greater future cash flows which would increase its intrinsic value. Nevertheless, just because interest rates are low does not mean that you should be paying a higher value. You should only be paying a higher value if the growth of the business is substantially enhanced as a result.
Abbvie Inc (ABBV)
Additional Evidence: Microsoft Corp.: 2001 through 2011
In summary, like many of you, I originally believed that there would be an inverse relationship between P/E ratios (multiple valuation measurements) and interest rates. The lower the rate, the higher the P/E – and vice versa. Therefore, when I originally developed FAST Graphs, I created the “P/E Interest Rates” graphic so that I could measure that relationship. However, I soon learned that there were many other more important forces than interest rates that drove market multiples. To be clear, I did not say intrinsic value multiples, I said market multiples.
Let us use the Microsoft example that many readers referred to in my previous article “Apple, Microsoft, Visa: Crazy Or Crazy Like A Fox” which was actually the mother of this follow-up article found here.
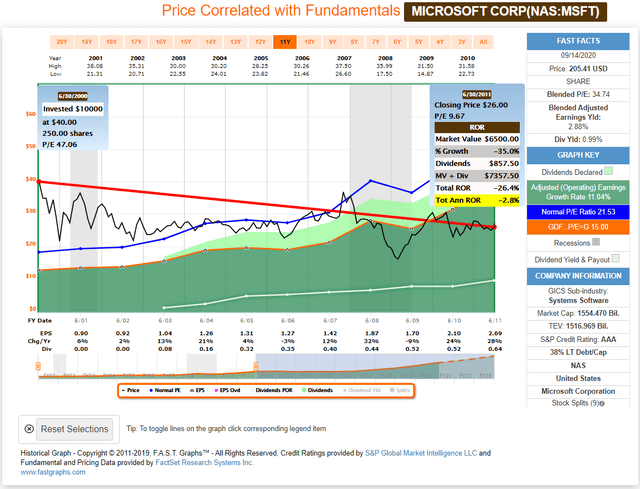
On June 2000 Microsoft traded at a P/E ratio of 47.06 and interest rates (the 10 year treasury) were 6.03%. On June 2001 Microsoft’s P/E ratio fell to 40.561 when the interest rate dropped to 5.42%. This relationship steadily continued until June 2010 when Microsoft’s P/E ratio fell all the way to 9.67 and interest rates had fallen to 1.92%. In other words, Microsoft’s P/E ratio and interest rates both fell in literal lockstep tandem.
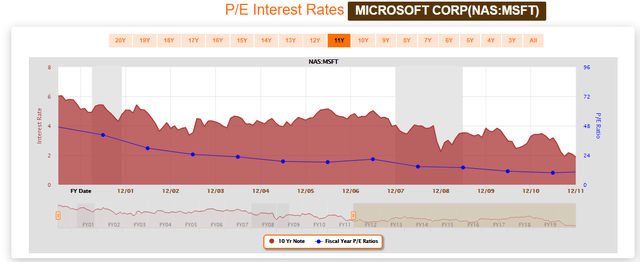
The culprit, was significant overvaluation by Mr. Market on Microsoft’s stock. Consequently, dropping interest rates could not overcome the ravages of excessive valuation. By the way, Microsoft grew earnings at 11% per annum while this happened. Growth of Microsoft’s earnings since June 2012 (fiscal year end) only grew at 8.83% per annum through June 2020 – the last completed year. Therefore, contrary to what many believe, Microsoft’s earnings performance was exceptional even though the P/E ratio and interest rates were both falling. More importantly, they were better than the company has generated during the recent extreme valuation that the market has been applying.
FAST Graphs Analyze Out Loud Video
For added color and perspective on this important subject, I humbly suggest that you take the time to watch the following video. Since the graphics are interactive, I will go through a live demonstration of each of the examples presented. Consequently, I believe the important principles discussed will be greatly enhanced.
Summary and Conclusions
The primary thesis behind this article is simply to point out that interest rates are an exogenous factor. Therefore, they do not directly impact the intrinsic value of a business (common stock). Instead, they obviously have an impact on how some people will perceive that a higher valuation is warranted because interest rates are low. Interest rates truly only have a direct effect if they simultaneously provide the business the ability to generate higher earnings and cash flows. Otherwise, it is simply a discussion of perception versus reality.
Nevertheless, at the end of the day, no matter what the rationale, when you pay a higher valuation for any stock at any time, you will earn less than had you purchased it at a lower valuation. When it comes to long-term returns and risk, valuation matters, and it matters a lot. But most importantly, valuation is a direct force that is functionally related to how much money the business makes for its shareholders. The more you pay for that income stream, the less you get back in return.
Try FAST Graphs for FREE Today!