Ben Graham’s famed formula for valuing a stock works in the real world!
V* = EPS x (8.5 + 2g)
Ten Real World examples of companies growing between zero and 5%
These ten examples are based on our article: “A primer on valuation: Testing the Wisdom of Ben Graham’s Formula” (part one) published on 2/08/2011. These represent just a few examples of many we could provide. Ben’s formula works because it is sound.
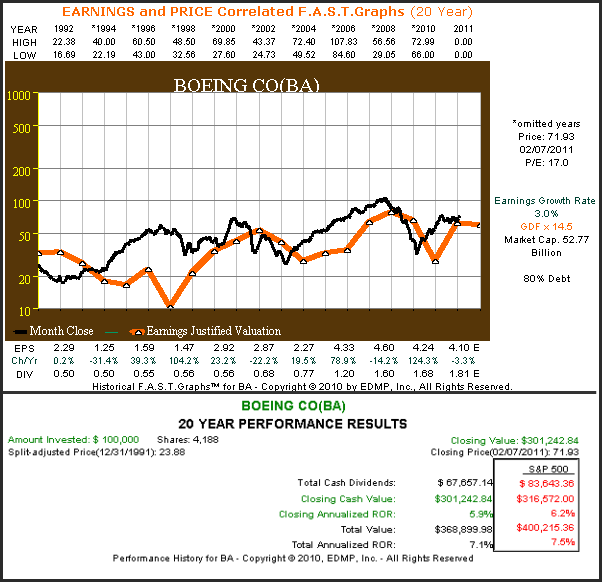
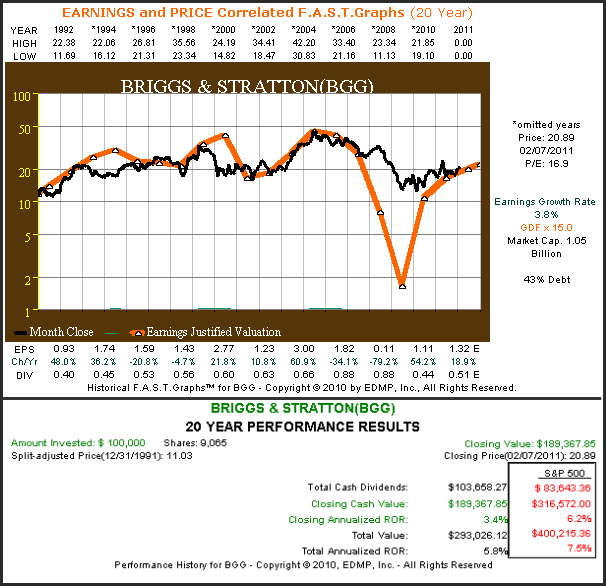
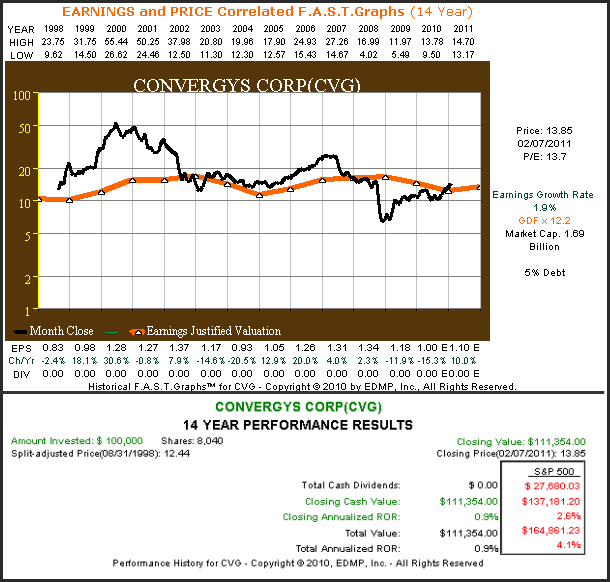
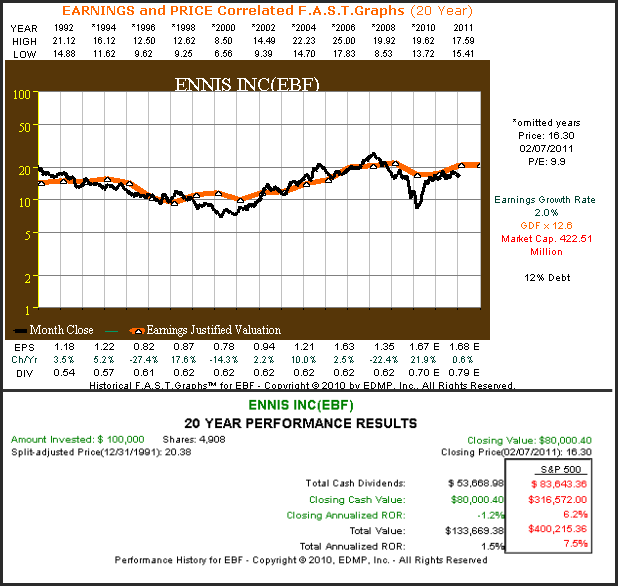
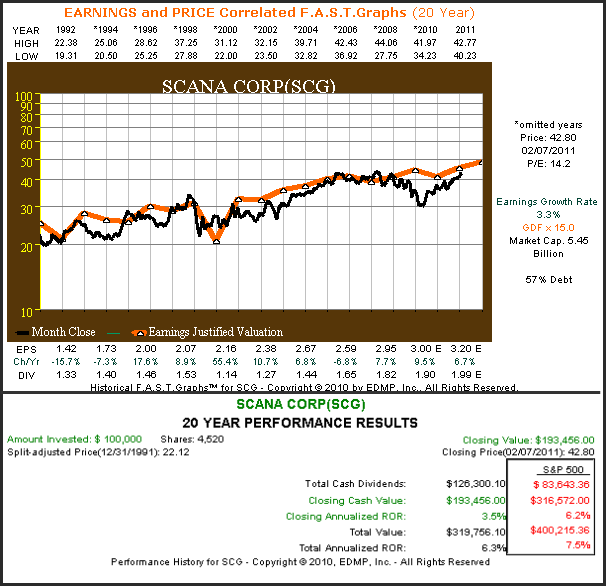
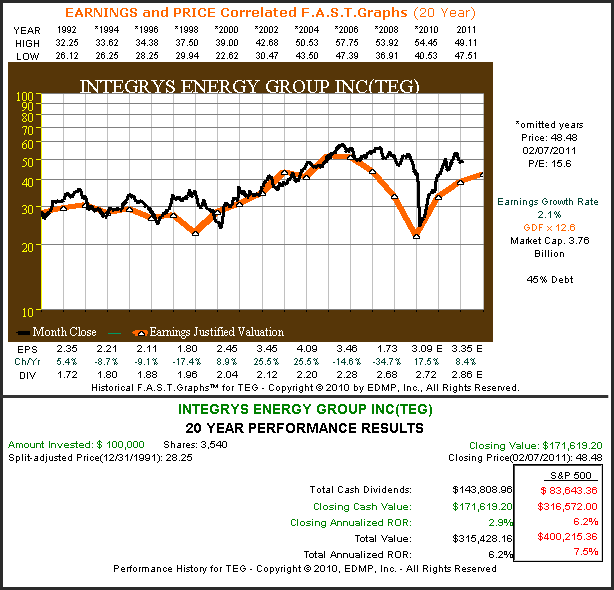
The orange line on each logarithmic below represents earnings multiplied by Ben Graham’s formula. As you review each note how the black price line tracks and correlates to Ben Graham’s calculation of intrinsic value. In some cases, the correlation is almost perfect. In other examples, such as Boeing Co. (BA), there is more deviation between price and intrinsic value, which is due to the cyclical nature of this aerospace industrial. Yet even with (BA), the stock price inevitably moves to Ben’s valuation. However, in all cases, the validity of Ben Graham’s formula is verified.
When reviewing the performance calculations for each example, notice how the closing annualized rate of return (the capital appreciation component) closely correlates with earnings growth. Any difference between earnings growth in the closing annualized rate of return can be explained by valuation anomalies. But essentially, long-term shareholder returns are functionally related to the earnings growth the company achieves. Anomalies can be explained by valuation anomalies, for example, if starting valuation is low and ending valuation is high then the closing annualized rate of return will be higher than growth rate and vice versa.
Boeing Co. (BA)
Briggs & Stratton (BGG)
Convergys Corp. (CVG)
Ennis Inc. (EBF)
FMC Corp. (FMC)
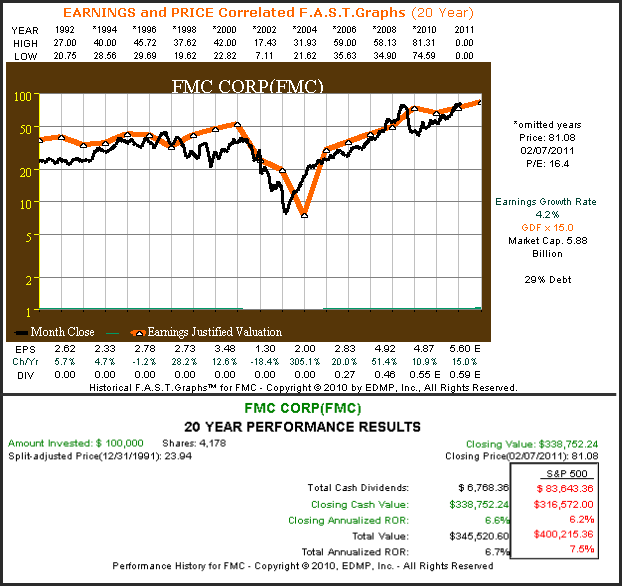
Nisource Inc. (NI)
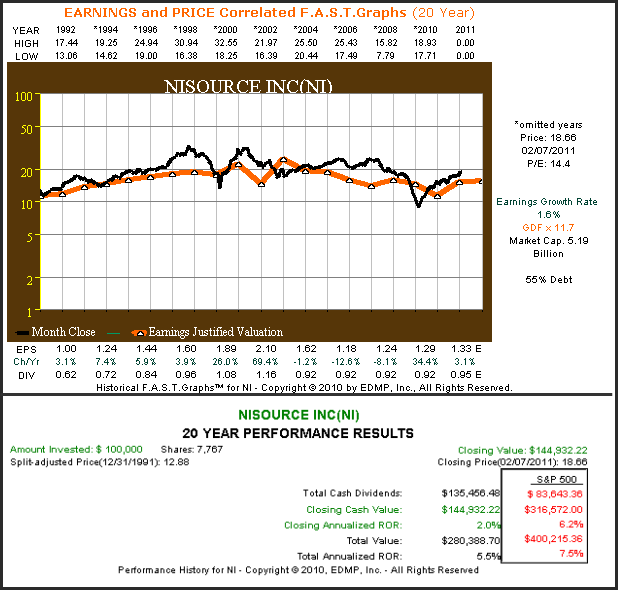
Northrop Grumman Corp. (NOC)
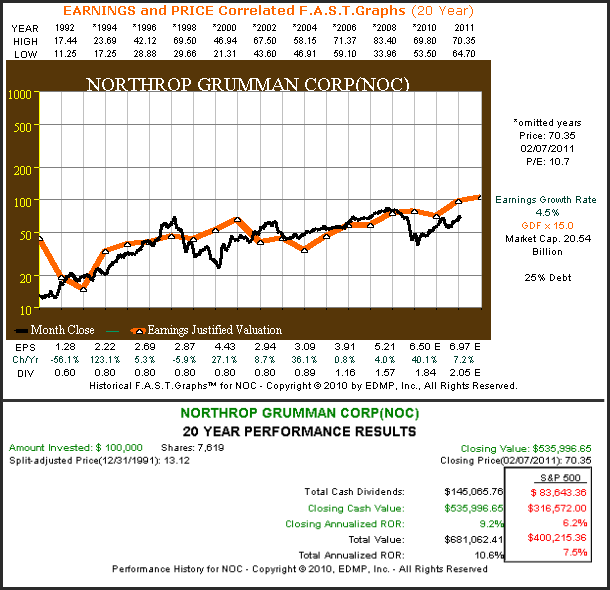
Newell Rubbermaid Inc. (NWL)
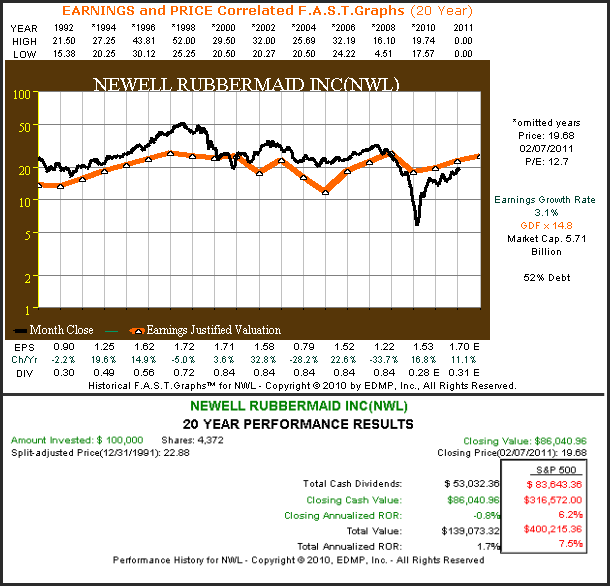
Scana Corp. (SCG)
Integrys Energy Group Inc. (TEG)
Conclusions
Ben Graham’s formula works for low growth companies (earnings growth between zero and 5%) because it is based on sound principles of business and economics. As a general statement, when you purchase a company when the price is in line with its intrinsic value, your earnings yield rewards you for the risk you take. When you overpay for a company, your earnings yield is inadequate, and therefore, your risk is too high and your future returns less. If you underpay, the opposite is true; your risk is lower because you now enjoy a margin of safety, and your long-term returns will be enhanced. Lower risk and higher returns is ultimately what Ben Graham was all about.
Disclosure: I am long SCG.
Disclaimer: The opinions in this document are for informational and educational purposes only and should not be construed as a recommendation to buy or sell the stocks mentioned or to solicit transactions or clients. Past performance of the companies discussed may not continue and the companies may not achieve the earnings growth as predicted. The information in this document is believed to be accurate, but under no circumstances should a person act upon the information contained within. We do not recommend that anyone act upon any investment information without first consulting an investment advisor as to the suitability of such investments for his specific situation.