A Market Crash Is Coming
A market crash is pending and could possibly be imminent. I am quite certain about this for reasons I will provide shortly. However, what I am not certain about is just how imminently (SOON) it might happen. This bull market could last another year or more, or it could abruptly end any day now. As they say in Wall Street parlance, they do not ring a bell at the top or bottom of a market. Nevertheless, whether you agree or not, I believe it would be hard to argue that the markets are not currently trading at extremely lofty levels. It is a factual statement that based on any historical precedent, stocks in the general sense (as measured by the S&P 500 for example) are quite expensive.
Here are the promised reasons why I am certain that a market crash and even a recession is coming. First and foremost, all bull markets end with a bear market and vice versa. The same can be said about stronger economies and weak economies. Nothing in economies or markets are permanent except perhaps that they cycle. The laws of supply and demand will eventually come into play and markets and economies will temporarily at least change from good to bad – and vice versa. And the cycle continues into perpetuity.
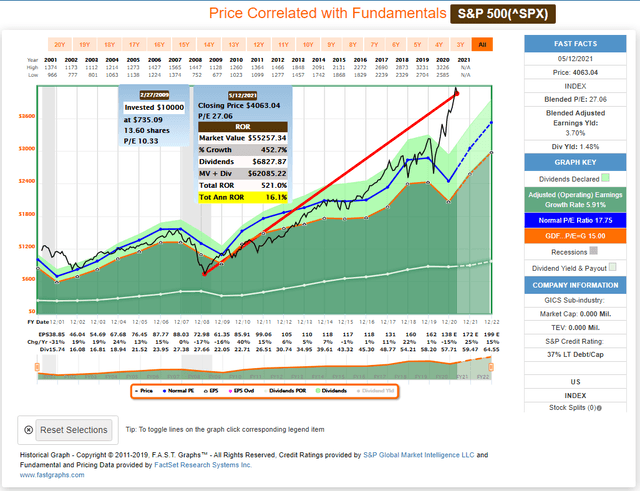
Additionally, logic and common sense dictates that the longer a good or a bad market runs, the closer it gets to the end. This has been a very long running bull market, especially if you are willing to overlook the Covid 19 flash crash. Covid 19 brought a “flash crash” where from January 1, 2020 through March 31, 2020 the market fell approximately 20%. Moreover, the market recovered back to its previous high by July 31, 2020 and has since gone on to all-time highs. Consequently, it can be argued that after bottoming during the Great Recession on March 27, 2009, the S&P 500 has been on a bull run for more than a decade notwithstanding the very short interruption brought on by the pandemic.
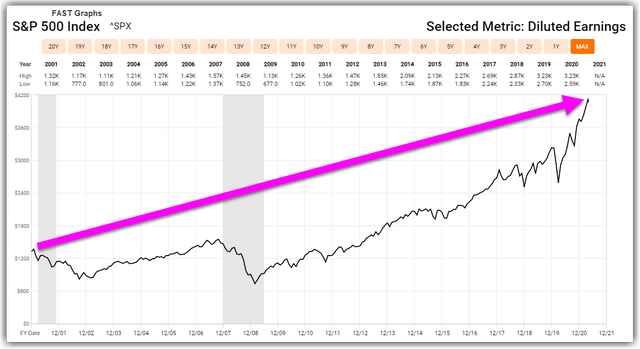
The following FAST Graph of the S&P 500 illustrates how overvalued the general market is. Additionally, it illustrates how short lived the Great Recession was relative to the subsequent bull market we have been enjoying now for more than a decade. It also shows how temporary the pandemic flash crash lasted and how strongly stocks have recovered since. As a long-term investor, I do not fear short-term corrections and recessions, instead, I exploit the long-term opportunity they bring.
Reason Number 1: It is a Market of Stocks and Not a Stock Market
Therefore, since I do not invest in the index, I am not concerned with what the overall market might do. Instead, I am only concerned with the businesses (stocks) that I have a vested interest in. Or as I like to put it, “I mind my owned businesses.” The following are examples of just how different individual stocks are that make up the so-called stock market. These are only a few samplings of all the many differences that can be found when examining individual stocks.
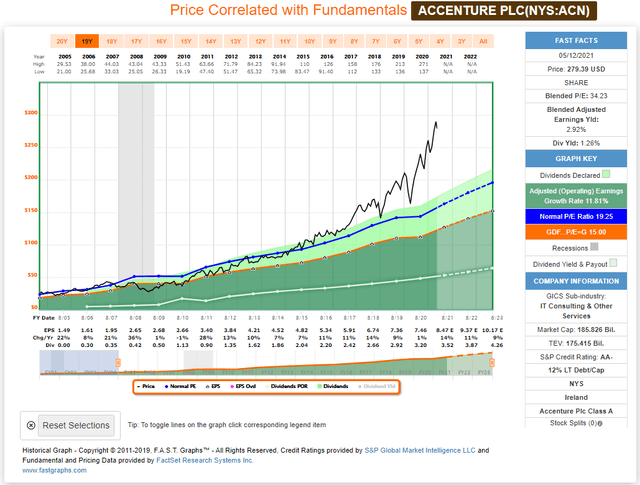
Accenture PLC (ACN): Overvalued Blue-Chip
Great consistent AA- rated growth stock extremely overvalued. Here we have a great company at a lousy valuation. Consequently, a great overvalued business would likely be a mediocre investment in the future if purchased today.
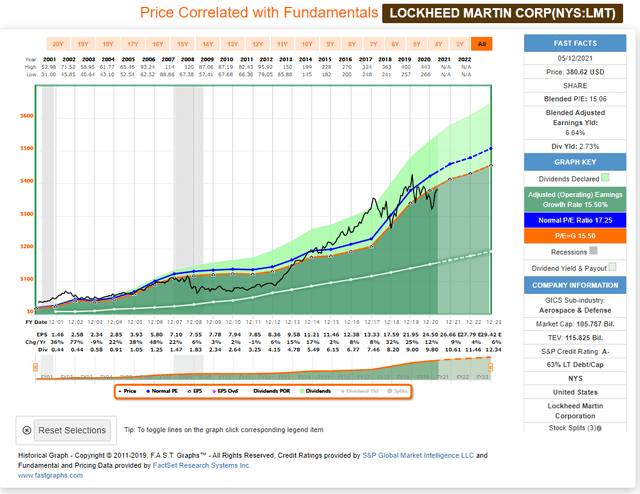
Lockheed Martin Corp. (LMT): A Great Company At Fair Value
Even in today’s inflated market environment, there are good companies to be found at attractive or fair valuation. It is a market of stocks.
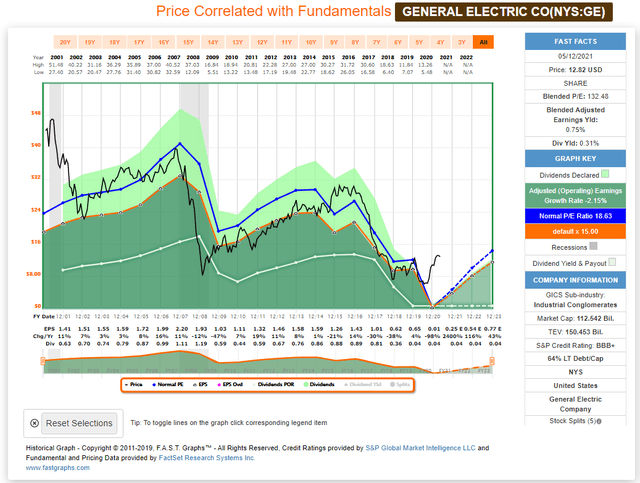
General Electric Company (GE): A Fallen Angel
General Electric once considered one of the bluest of all blue chip’s, has not participated in the long running bull market. Fundamentals and stock price have deteriorated, and the dividend cut and slashed several times.
Reason Number 2: Only Invest With A Margin Of Safety
As a card-carrying diehard value investor, I initially always build my portfolio defensively by only being willing to invest in undervalued stocks. This provides me the value investor’s critically important margin of safety that protects my portfolio in all markets. This does not suggest that the stocks I purchased at attractive valuations could not initially fall with all stocks in a panicked market. In truth, they probably would. However, if the fundamentals remain strong and intact, they are sure to not only recover, but to go on to higher heights. In other words, price volatility is inevitable but fundamentals and fundamental strength matter more. As a value investor I do believe that the best offense is a strong defense.
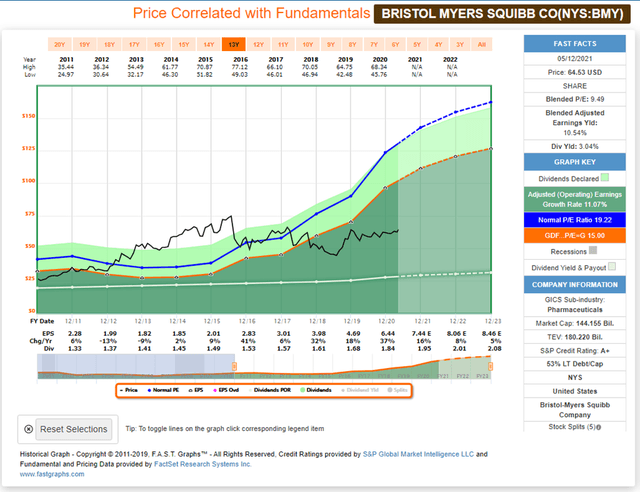
Bristol Myers Squibb Co (BMY)
As you can see, Bristol Myers is available at a significant margin of safety with the price far below the orange intrinsic value line. In other words, the risk is already priced in.
Reason Number 3: Dividends Are Predictable
In addition to being a value investor, I am also a devotee of dividend growth investing. Dividends tend to be the most reliable and predictable aspect of investing in stocks. Therefore, even during a period of falling prices, well selected blue-chip dividend paying stocks such as S&P Dividend Aristocrats, or Dividend Champions, Contenders and Challengers will not only tend to keep paying their dividends but raise them as well. Since I did not invest in these blue-chip dividend growth stocks to sell them, I can confidently ride out the inevitable price volatility that comes with the territory.
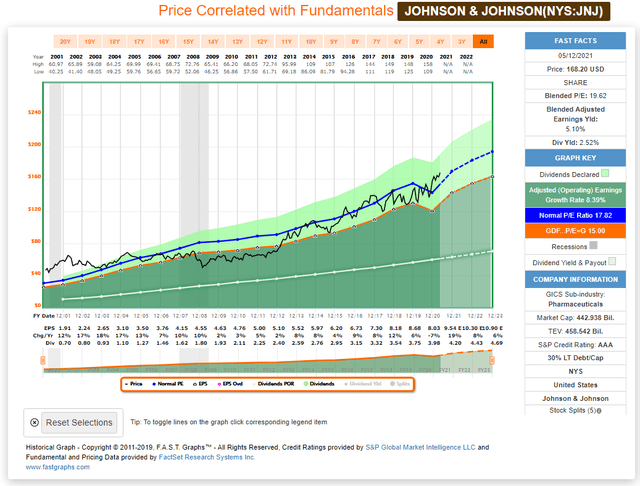
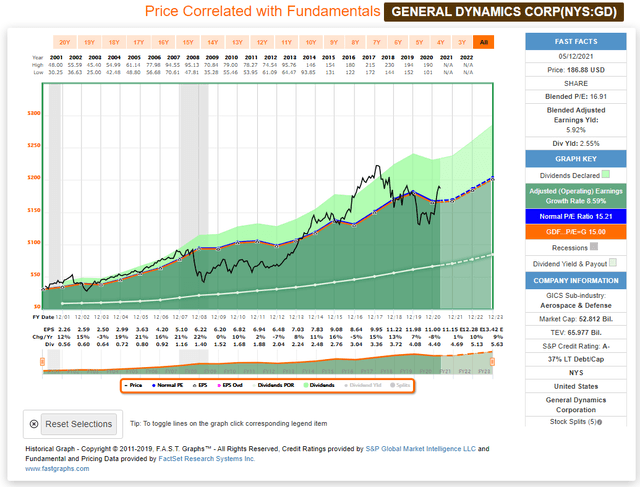
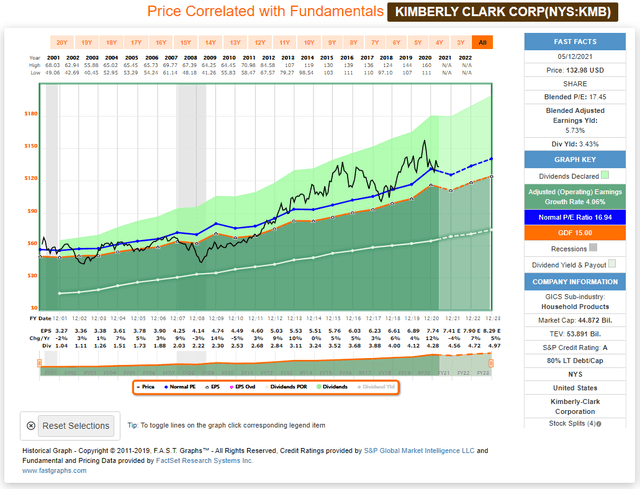
Johnson & Johnson (JNJ), General Dynamics (GD) and Kimberly-Clark (KMB)
What follows are 3 blue chips that raise their dividends during the Great Recession. Additionally, all 3 also raised their dividend through the pandemic. These are just a few of the many examples of high-quality blue-chip dividend growth stocks maintaining their dividends and dividend growth during bad times.
Reason Number 4: Bull Markets Last Longer Than Bear Markets
Historically both bear markets and market corrections tend to be short-lived relative to the length of bull markets and stronger economies. As a result, levelheaded value investors – such as yours truly – see market corrections and recessions as opportunities rather than something to fear. As a seasoned money manager, I often state that I live in a proverbial money manager hell. When my clients are euphoric and even giddy, I’m conversely depressed. When my clients are depressed, I tend to be euphoric and giddy.
The point I am trying to convey is that as a value investor I see bear markets and recessions as short-term opportunities to make long-term investments in a generally rising market. In other words, I see market corrections as the pause that refreshes. Reason number 3, the predictability of dividends, allows me to continue gaining positive income levels while I reposition my portfolio and wait for the capital appreciation to inevitably and eventually happen.
Below is a chart and graph that I found courtesy of dshort.com dated August 2012 that shows the duration of each recession going back to the early 1950s. This clearly illustrates that recessions tend to be short lived and bull markets tend to be longer lived. How you react to a bear market or recession is in my opinion relative to how you position yourself as an investor. If you are a long-term investor and apply sound fundamental principles to your investing strategy, you can survive the occasional and inevitable interruptions. If you are actively trading your portfolio, then that is a different matter. Of course, this is why I prefer long-term investing over active trading.
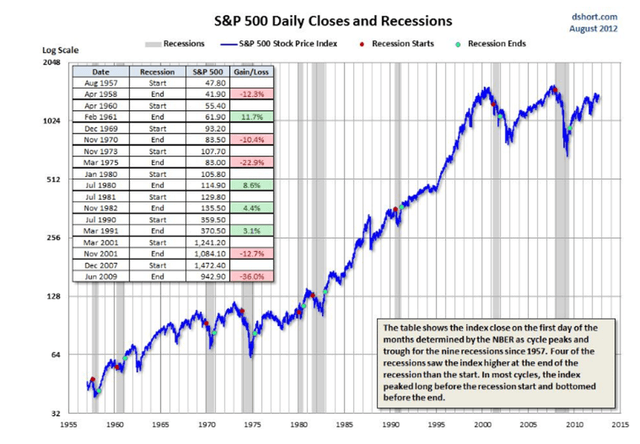
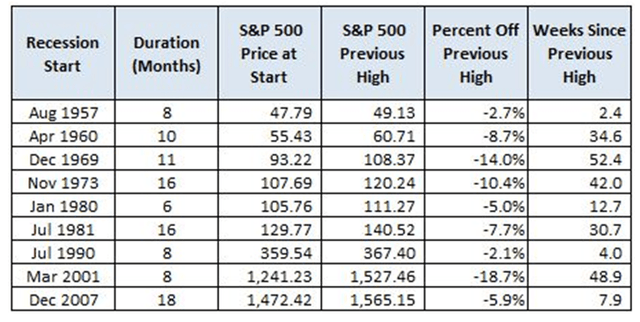
To update the graphics above, we see clear evidence that over the long run stock prices rise. This is a classic picture of my metaphor that suggests that great investors and great mountain climbers share a common understanding. They both understand that the only way to get to the next higher peak is to be willing to traverse the occasional valleys that come in between.
In the following video I will review Kimberly Clark (KMB), McDonalds (MCD), Wal-Mart (WMT), Cisco Systems (CSCO), Coca Cola (KO), Clorox (CLX), United States Steel (X), Kulicke & Soffa (KLIC), Amazon (AMZN), Ford (F), AmerisourceBergen (ABC), Bristol Myers (BMY), Apple (AAPL), and Prudential (PRU).
FAST Graphs Analyze Out Loud Video:
Summary and Conclusions
As a long-term oriented value investor, I truly do see market corrections and recessions as opportunities to exploit a long-term growth provided by quality stocks. Importantly, since I am not actively trading my portfolio, I am not investing with the objective of quickly selling. Instead, I am investing in order to position myself as a long-term shareholder, owner, partner in solid blue-chip growing dividend paying investments. Anytime I get the opportunity to invest in those companies at very attractive valuations is always a plus. Therefore, I do not fear bear markets are recessions, instead, I look forward to the opportunities they provide.
Finally, I do not want to come off as purely Pollyanna. For example, dividends are predictable and the bluest of blue chips continue increasing their dividends even during recessions. However, as evidenced by the recent pandemic, there are exceptions to that generality. There were blue chips that did cut, pause, or freeze their dividends during the pandemic recession. Nevertheless, they were in the minority – not the majority. Furthermore, many that did temporarily cut their dividend have reinstated their dividends and even increased them. Investing is not a game of perfect, but the odds favor the long-term value-oriented investor over the long run.