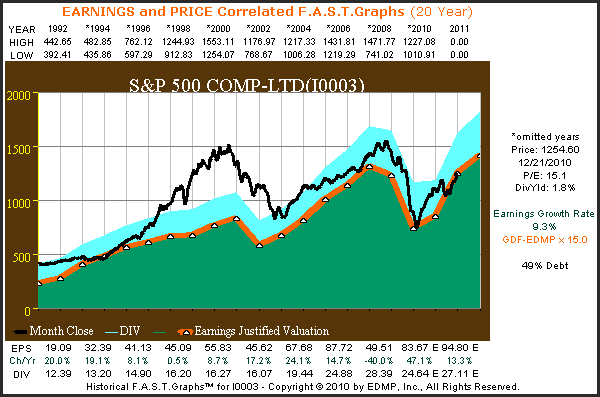
On September 5, 2010, we published an article on Seeking Alpha that suggested that the S&P 500 would reach 1245 by year end. Then on November 2, 2010 we republished our fair value S&P 500 calculation based on updated earnings forecasts by Standard & Poor’s Corp. The new forecast implied that the S&P 500 would reach 1254.22 based on earnings estimates of $83.62 for 2010. Links to both of these articles are found here: September 5, 2010 Article and November 2, 2010 Article.
Now, December 22, 2010 we offer our final update for the year with our EDMP, Inc. F.A.S.T. Graphs™ below. Since November 2, 2010 little has changed, therefore, current estimates are only a few cents higher than the forecast on November 2. Consequently, the S&P 500 appears fairly valued at just under 1255 as depicted in our EDMP, Inc F.A.S.T. Graphs™ below. We doubt this will change much between now and the New Year, regardless, our targeted fair value estimate made in November has been achieved.

click to enlarge
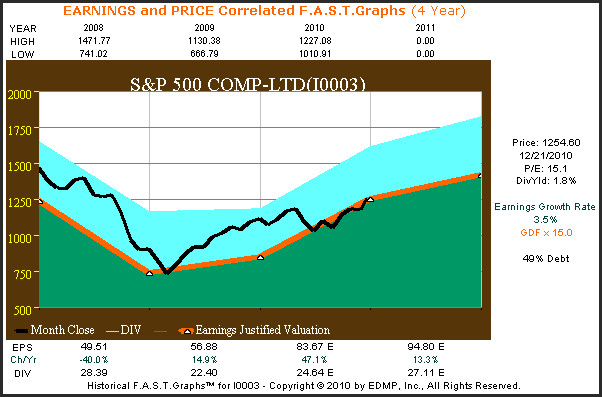
The EDMP, Inc. F.A.S.T. Graphs™ below looks at the S&P 500 since the beginning of the great recession of 2008. This shorter graph is merely offered to provide a clearer view of the S&P 500 fair value of 15 times earnings. From this graph it is clear that the S&P 500 stock price has been closely tracking its earnings justified fair value (orange line) since June of this year.

Observations and Conclusions
When we first published these articles we pointed out that the normal price earnings ratio of the S&P 500 for the past 80 years has been 15. Unfortunately, many misinterpreted this as merely a historical average. Our real point was that a fair value of 15 times earnings for the S&P 500 is based on its True Worth™ valuation and not just a matter of history. Another way of looking at it is to recognize that a PE ratio of 15 represents the fundamental value of a broad basket of equities like the S&P 500.
Fundamental value comes from the market capitalizing the stream of income or earnings that are generated by the companies. Common sense dictates that a stream of income has a value greater than itself, which would be a P/E ratio of one. Even a no growth stream of income generated by fixed income instruments has a value greater than one which is how yield is derived. To be clear, an 8% bond, CD, etc. would be capitalized at 12 1/2 times interest. The simple calculation is to divide the interest rate into the cost of the fixed income instrument (100%/8%=12.5).
Since most companies possess a growing income stream (earnings growth rate) it’s only logical that their growing stream of income would be worth more than one that is fixed. Therefore, 15 times earnings does have a logical mathematical foundation underpinning its implied fundamental value. Yes, it’s true that an equity does have a higher risk profile than a fixed income vehicle, but also has the opportunity for higher returns based on growth. Therefore, a higher valuation makes sense.
Another point of confusion that we would like to provide clarity on, is the statistical reference that the average P/E ratio of the S&P 500 has been a higher than average 17 to 18 over the last 20 years. Therefore, some mistakenly interpret this higher average to be the more modern norm. However, we would like to point out that this higher average P/E ratio over the past 20 years has been a result of excessive overvaluation that existed starting in 1995 and spanning into calendar year 2004 (see 20 year F.A.S.T. Graphs™ above). In our opinion, this excessive overvaluation merely skewed the numbers temporarily, but did not change the principles behind intrinsic value.
Even though our forecast for the year-end value of the S&P 500 has come to pass, this is not the important issue. What’s important for us is to alert investors to the importance of making sound investing decisions based on fundamental values. It is a given that the market will, and often does, misprice equities at any given point in time. On the other hand, we believe it’s also a given that regardless of whether overvalued or undervalued, prices will inevitably move back to sound fundamental valuation.
At the end of the day, all an investor can really logically expect to do is make sound decisions based on fundamentals. Although the stock market will often test your mettle over short periods of time, when acting irrationally, price action is also unpredictable. However, when decisions are based on the principles of sound valuation there does exist a foundation of value that investors can rely upon. So, as this year comes to a close, we wish everyone a Happy Holiday Season, and most importantly, a Prosperous New Year.
Disclaimer: The opinions in this document are for informational and educational purposes only and should not be construed as a recommendation to buy or sell the stocks mentioned or to solicit transactions or clients. Past performance of the companies discussed may not continue and the companies may not achieve the earnings growth as predicted. The information in this document is believed to be accurate, but under no circumstances should a person act upon the information contained within. We do not recommend that anyone act upon any investment information without first consulting an investment advisor as to the suitability of such investments for his specific situation.