Over a Century of Service
The McGraw-Hill Companies (
MHP) traces its roots back to the 1800s. James H. McGraw founded the McGraw Publishing Company in 1899 and John Hill formed the Hill Publishing Company in 1902. In 1909 the two cofounders of today’s McGraw-Hill Companies (
MHP) formed McGraw-Hill. Over the many decades that followed, the company expanded beyond publishing into the global information services provider they are today. The following excerpt from their website summarizes their business and its legacy quite nicely.
“The Foundation
The McGraw-Hill Companies has been a leader in providing high quality information and analysis across global markets for more than a century. From the Industrial Revolution through the Digital Revolution, our core values have remained constant — The McGraw-Hill Companies (MHP) is helping to create a smarter, better world by meeting critical needs for the knowledge, insights and analysis that help individuals, markets and countries grow and prosper.”
McGraw-Hill Companies has long been on our candidate list of consistent above-average earnings growth achievers, and dividend growth stories. This large-cap blue chip has paid a dividend each year since 1937 and is one of the very few companies that can boast of increasing their dividend for 37 years straight. However, we’ve never owned the stock because the market has historically priced them at valuations that exceeded our disciplined buying criteria.
Figure 1A below looks at McGraw-Hill through the lens of our EDMP F.A.S.T. Graphs™ for the period 1992 through 2007. As the graph reveals, the black monthly closing price line has been consistently above our orange earnings justified value line over most of this timeframe. The blue line with an asterisk (*) indicates a calculated normal PE ratio that the stock market assigned to McGraw-Hill over 1992 to 2007. Interestingly, by the end of 2007 the price finally moved back to its earnings justified level.
Figure 1A McGraw-Hill EPS Growth Correlated to Price 1992 through 2007
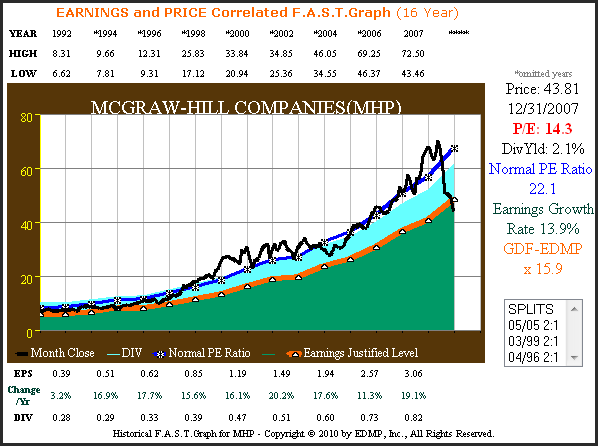
Figure 1B calculates the performance associated with Figure 1A. Note how closely McGraw-Hill’s earnings growth rate of 13.9% correlates to their closing annualized rate of return of 12%. The modestly lower return was a result of 2007 closing price ending just below value. McGraw-Hill’s exemplary dividend record is also seen through the dividend cash flow table.
Figure 1B McGraw-Hill Performance History – 1992 through 2007
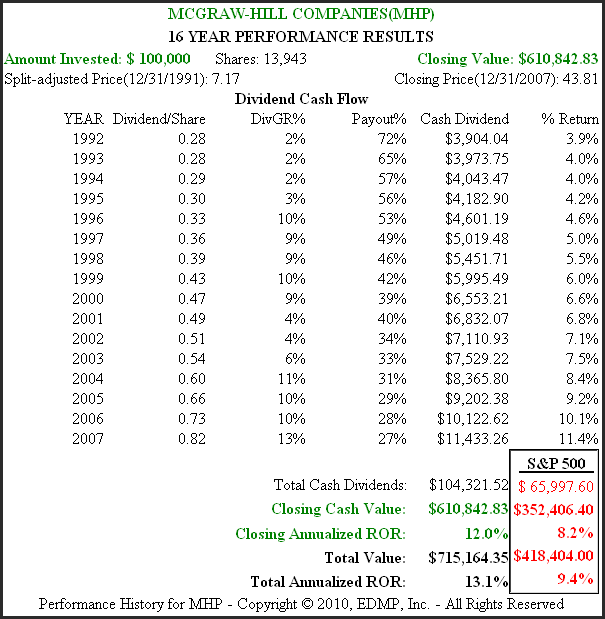
Figure 2A below updates the MHP earnings and price correlated F.A.S.T. Graphs to current and includes the consensus estimate of earnings through 2011. This graph reveals several things that happened to McGraw-Hill’s price and earnings record since calendar year 2007. First of all, even though earnings fell during the recession, McGraw-Hill nevertheless remained strongly profitable.
The two down years of earnings in a row generated an extreme stock market price reaction. Consequently, McGraw Hill’s stock price is currently trading at a price earnings ratio of 11.1 today, which is almost half of their historical normal PE ratio.
Figure 2A McGraw-Hill 20-year EPS Growth Correlated to Price
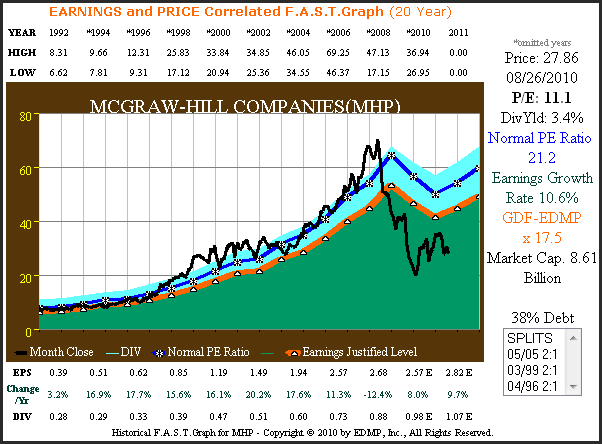
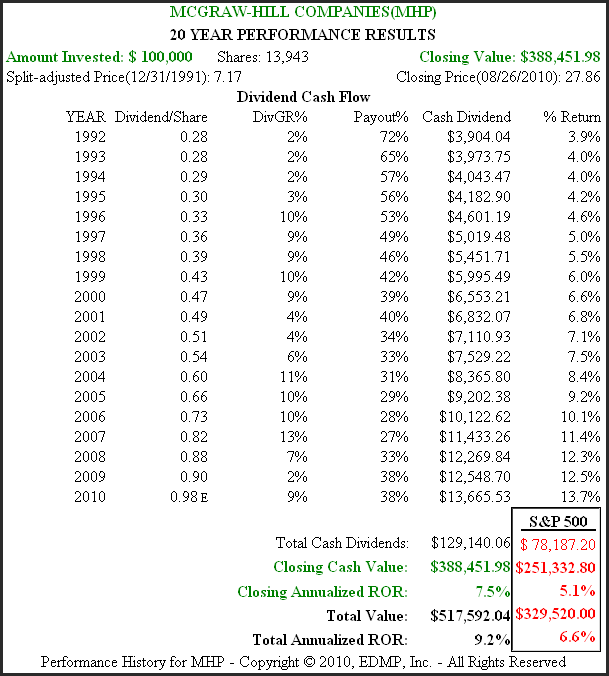
Figure 2B below calculates the performance associated with Figure 2A. Today’s current historical undervaluation did cause long-term shareholder returns to fall below McGraw-Hill’s historically achieved earnings growth rate. Yet, even at today’s current historically low valuation, McGraw-Hill shareholders still outperformed the S&P 500. Importantly, McGraw-Hill continued their streak of dividend increases, albeit at a much slower rate than they historically grew them at.
Figure 2B McGraw-Hill 20-year Performance History
McGraw-Hill at a Glance
McGraw-Hill operates three primary business segments:
1. Financial Services – their largest segment representing just under 45% of their total revenue. The crown jewel of this important segment is Standard & Poor’s Corp. However, it was Standard & Poor’s credit ratings business that was responsible for much of their recent earnings shortfalls during the past financial crises.
2. McGraw-Hill Education – their second-largest segment generates approximately 40% of their revenues. McGraw-Hill is a leading publisher for education serving elementary and high school markets and their higher education group serves colleges and professional markets.
3. Information and Media Services – their smallest segment generates a little over 15% of their revenues. This segment includes important businesses such as J.D. Power & Associates (acquired in 2005), Platts, Aviation Week and the broadcasting group which operates nine television stations.
McGraw-Hill sold its BusinessWeek magazine to Bloomberg in 2009.
The Future
According to a report by Bill Bergman of Morningstar on July 26, 2010, the wide moat that McGraw-Hill has enjoyed for many years may be weakening:
“But that moat is now under increasing stress. Reputation is key to the firm’s financial services segment, and the financial services segment has been a major contributor to operating cash flow. The role of S&P’s credit ratings in the structured finance meltdown in 2007- 08 has undermined the firm’s credibility with financial market participants, regulators, and Congress.
S&P has long enjoyed high market share and attractive profit margins, thanks to an oligopoly position cemented by regulatory practices that restricted much of the credit rating market to a few key players. Amid the explosive growth in complex structured financial products in the mid-2000’s, S&P and Moody’s benefited from collecting a toll while rating debt instruments that flowed through their pipelines. But S&P was paid by developers of the securities, and ended up issuing ratings for a wide swath of complex, hairy instruments that proved quite overoptimistic.”
Therefore, since reputation is so critical in this business there is a question of what future profitability for Standard & Poor’s Corp. and McGraw-Hill may be. However, McGraw-Hill reported better-than-expected first quarter 2010 results thanks in large part to strong performance in Standard & Poor’s credit market services business. Nevertheless, this is a critical aspect of their business that needs to be monitored.
Consensus Forecasts
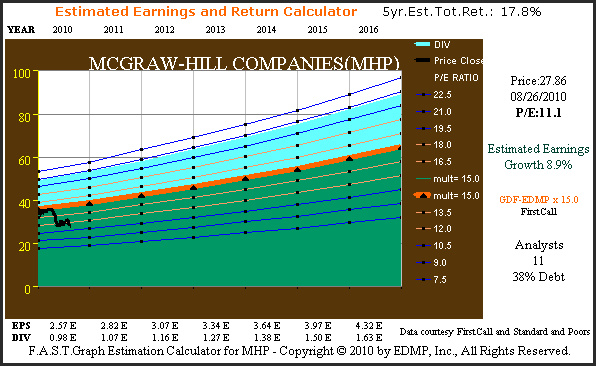
Figure 3 below calculates McGraw-Hill’s potential future profitability based on the consensus five-year forecast for earnings by 11 analysts reporting to FirstCall. If the 8.9% estimated growth proves to be accurate, then McGraw-Hill would be an excellent candidate for investors seeking a quality stock that is reasonably priced.
Figure 3B McGraw-Hill Estimated Earnings & Return Calculator
Conclusion
McGraw-Hill is a company that generated exemplary and consistent operating results up through calendar year 2007. That all changed as a result of the structured finance meltdown in calendar years 2007-2008, which damaged the reputation of their large and important financial services segment. However, it looks like McGraw-Hill, and more specifically Standard & Poor’s Corp. is on track to rebuild their long-standing sterling reputation.
Meanwhile, McGraw-Hill’s other two business segments appear poised for long-term growth. Therefore, it’s possible that current consensus estimates for earnings growth may actually be conservative. McGraw-Hill Companies currently offers a 3.4% dividend yield that is only a couple of tenths of a percent below the yield on a 30-year treasury bond, and is well protected by strong cash flows. Therefore, it is possible that prospective investors would be well paid as they wait to see if McGraw-Hill’s recovery comes to fruition.
Although our research process is only at a preliminary stage, we believe that McGraw-Hill is a promising candidate worthy of further effort. Today’s valuation appears compelling assuming that McGraw-Hill returns to its long history of reliable and consistent earnings growth. If they do, our confidence is very high that their long record of dividend increases will continue as well. Therefore, we recommend that investors may want to take a closer look at McGraw-Hill Companies.
Disclosure: No positions at the time of writing
Disclaimer: The opinions in this document are for informational and educational purposes only and should not be construed as a recommendation to buy or sell the stocks mentioned or to solicit transactions or clients. Past performance of the companies discussed may not continue and the companies may not achieve the earnings growth as predicted. The information in this document is believed to be accurate, but under no circumstances should a person act upon the information contained within. We do not recommend that anyone act upon any investment information without first consulting an investment advisor as to the suitability of such investments for his specific situation.


